Definition: A numerical function is a correspondence that to each number x from some given set compares singular y.
Designation:
where x is the independent variable (argument), y is the dependent variable (function). The set of values of x is called the domain of the function (denoted D(f)). The set of values of y is called the range of values of the function (denoted E(f)). The graph of a function is the set of points in the plane with coordinates (x, f(x))
Methods for specifying a function.
- analytical method (using a mathematical formula);
- tabular method (using a table);
- descriptive method (using verbal description);
- graphical method (using a graph).
Basic properties of the function.
1. Even and odd
A function is called even if
– the domain of definition of the function is symmetrical about zero
f(-x) = f(x)

Schedule even function symmetrical about the axis 0y
A function is called odd if
– the domain of definition of the function is symmetrical about zero
– for any x from the domain of definition f(-x) = –f(x)

Schedule odd function symmetrical about the origin.
2. Frequency
A function f(x) is called periodic with period if for any x from the domain of definition f(x) = f(x+T) = f(x-T) .

The graph of a periodic function consists of unlimitedly repeating identical fragments.
3. Monotony (increasing, decreasing)
The function f(x) is increasing on the set P if for any x 1 and x 2 from this set such that x 1

The function f(x) decreases on the set P if for any x 1 and x 2 from this set, such that x 1 f(x 2) .

4. Extremes
The point X max is called the maximum point of the function f(x) if for all x from some neighborhood of X max the inequality f(x) f(X max) is satisfied.
The value Y max =f(X max) is called the maximum of this function.

X max – maximum point
At max - maximum
A point X min is called a minimum point of the function f(x) if for all x from some neighborhood of X min, the inequality f(x) f(X min) is satisfied.
The value Y min =f(X min) is called the minimum of this function.

X min – minimum point
Y min – minimum
X min , X max – extremum points
Y min , Y max – extrema.
5. Zeros of the function
The zero of a function y = f(x) is the following: argument value x, at which the function becomes zero: f(x) = 0.

X 1, X 2, X 3 – zeros of the function y = f(x).
Tasks and tests on the topic "Basic properties of a function"
- Function Properties - Numeric functions 9th grade
Lessons: 2 Assignments: 11 Tests: 1
- Properties of logarithms - Exponential and logarithmic functions grade 11
Lessons: 2 Assignments: 14 Tests: 1
- Square root function, its properties and graph - Function square root. Properties of square root grade 8
Lessons: 1 Assignments: 9 Tests: 1
- Power functions, their properties and graphs - Degrees and roots. Power functions Grade 11
Lessons: 4 Assignments: 14 Tests: 1
- Functions - Important Topics for repeating the Unified State Examination in mathematics
Tasks: 24
After studying this topic, you should be able to find the domain of definition various functions, determine intervals of monotonicity of a function using graphs, examine functions for evenness and oddness. Let's consider the solution similar tasks using the following examples.
Examples.
1. Find the domain of definition of the function.
Solution: the domain of definition of the function is found from the condition

Length of the segment coordinate axis is found by the formula:
Length of the segment coordinate plane is searched by the formula:
To find the length of a segment in a three-dimensional coordinate system, use the following formula:
The coordinates of the middle of the segment (for the coordinate axis only the first formula is used, for the coordinate plane - the first two formulas, for a three-dimensional coordinate system - all three formulas) are calculated using the formulas:
Function– this is a correspondence of the form y= f(x) between variable quantities, due to which each considered value of some variable quantity x(argument or independent variable) corresponds to specific value another variable, y(dependent variable, sometimes this value is simply called the value of the function). Note that the function assumes that one argument value X only one value of the dependent variable can correspond at. However, the same value at can be obtained with different X.
Function Domain– these are all the values of the independent variable (function argument, usually this X), for which the function is defined, i.e. its meaning exists. The area of definition is indicated D(y). By and large, you are already familiar with this concept. The domain of a function is also called the domain acceptable values, or ODZ, which you have long been able to find.
Function Range- this is all possible values dependent variable of this function. Designated E(at).
Function increases on the interval where higher value the argument corresponds to the larger value of the function. The function is decreasing on the interval in which a larger value of the argument corresponds to a smaller value of the function.
Intervals of constant sign of a function- these are the intervals of the independent variable over which the dependent variable retains its positive or negative sign.
Function zeros– these are the values of the argument at which the value of the function is equal to zero. At these points, the function graph intersects the abscissa axis (OX axis). Very often, the need to find the zeros of a function means the need to simply solve the equation. Also, often the need to find intervals of constancy of sign means the need to simply solve the inequality.
Function y = f(x) are called even X
![]()
This means that for any opposite meanings argument, the values of the even function are equal. The graph of an even function is always symmetrical with respect to the ordinate axis of the op-amp.
Function y = f(x) are called odd, if it is defined on a symmetric set and for any X from the domain of definition the equality holds:
![]()
This means that for any opposite values of the argument, the values of the odd function are also opposite. The graph of an odd function is always symmetrical about the origin.
The sum of the roots of even and odd functions (the points of intersection of the x-axis OX) is always equal to zero, because for every positive root X have to negative root –X.
It is important to note: some function does not have to be even or odd. There are many functions that are neither even nor odd. Such functions are called functions general view , and for them none of the equalities or properties given above is satisfied.
Linear function is a function that can be given by the formula:
Schedule linear function is a straight line and in general case looks in the following way(an example is given for the case when k> 0, in this case the function is increasing; for the occasion k < 0 функция будет убывающей, т.е. прямая будет наклонена в другую сторону - слева направо):

Graph of a quadratic function (Parabola)
The graph of a parabola is given by a quadratic function:
A quadratic function, like any other function, intersects the OX axis at the points that are its roots: ( x 1 ; 0) and ( x 2 ; 0). If there are no roots, then the quadratic function does not intersect the OX axis; if there is only one root, then at this point ( x 0 ; 0) the quadratic function only touches the OX axis, but does not intersect it. The quadratic function always intersects the OY axis at the point with coordinates: (0; c). Schedule quadratic function(parabola) may look like this (the figure shows examples that are far from exhaustive possible types parabolas):

Wherein:
- if the coefficient a> 0, in function y = ax 2 + bx + c, then the branches of the parabola are directed upward;
- if a < 0, то ветви параболы направлены вниз.
The coordinates of the vertex of a parabola can be calculated from the following formulas. X tops (p- in the pictures above) parabolas (or the point at which the quadratic trinomial reaches its largest or smallest value):
Igrek tops (q- in the figures above) parabolas or the maximum if the branches of the parabola are directed downwards ( a < 0), либо минимальное, если ветви параболы направлены вверх (a> 0), value quadratic trinomial:
Graphs of other functions
Power function
Here are some examples of graphs of power functions:

Inversely proportional call the function given by the formula:
Depending on the sign of the number k back schedule proportional dependence may have two fundamental options:

Asymptote is a line that the graph of a function approaches infinitely close to but does not intersect. Asymptotes for graphs inverse proportionality shown in the figure above are the coordinate axes to which the graph of the function approaches infinitely close, but does not intersect them.
Exponential function with base A is a function given by the formula:
a schedule exponential function may have two fundamental options (we also give examples, see below):

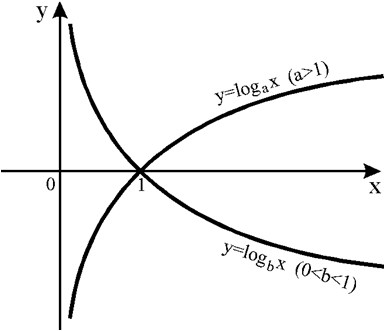
Logarithmic function is a function given by the formula:
Depending on whether the number is greater or less than one a schedule logarithmic function may have two fundamental options:
Graph of a function y = |x| as follows:

Graphs of periodic (trigonometric) functions
Function at = f(x) is called periodic, if there is such a non-zero number T, What f(x + T) = f(x), for anyone X from the domain of the function f(x). If the function f(x) is periodic with period T, then the function:
Where: A, k, b – constant numbers, and k not equal to zero, also periodic with period T 1, which is determined by the formula:
Most examples periodic functions- This trigonometric functions. We present graphs of the main trigonometric functions. The following figure shows part of the graph of the function y= sin x(the entire graph continues indefinitely left and right), graph of the function y= sin x called sinusoid:

Graph of a function y=cos x called cosine. This graph is shown in the following figure. Since the sine graph continues indefinitely along the OX axis to the left and right:

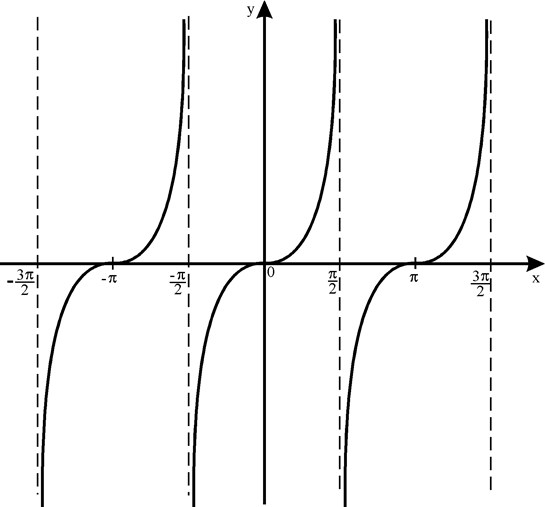
Graph of a function y= tg x called tangentoid. This graph is shown in the following figure. Like the graphs of other periodic functions, this schedule repeats indefinitely along the OX axis to the left and right.
And finally, the graph of the function y=ctg x called cotangentoid. This graph is shown in the following figure. Like the graphs of other periodic and trigonometric functions, this graph repeats indefinitely along the OX axis to the left and right.

Successful, diligent and responsible implementation of these three points will allow you to show up on the CT excellent result, the maximum of what you are capable of.
Found a mistake?
If you think you have found an error in educational materials, then please write about it by email. You can also report a bug to social network(). In the letter, indicate the subject (physics or mathematics), the name or number of the topic or test, the number of the problem, or the place in the text (page) where, in your opinion, there is an error. Also describe what the suspected error is. Your letter will not go unnoticed, the error will either be corrected, or you will be explained why it is not an error.
Function- This mathematical quantity showing the dependency of one element "y" from another "X".
In other words: addiction at called a variable function X, if each value that can take X corresponds to one or more defined values at. Variable X- This function argument.
Magnitude at always depends on the size X, therefore, the argument X is independent variable, and the function at - dependent variable.
Let's explain with an example:
Let T is the boiling point of water, and R - Atmosphere pressure. During observation, it was established that each value that can take R, always corresponds to the same value T. Thus, T is the argument function R.
Functional dependence T from R allows you to determine the pressure using special tables when observing the boiling point of water without a barometer, for example:
It can be seen that there are meanings argumentT, which the boiling point cannot take, for example, it cannot be less than " absolute zero"(- 273 °C). That is, an impossible value T= - 300 °C, no value corresponds R. Therefore, the definition says: “every value that can take X…", and not for each value of x...
Wherein R is argument functionT. Thus, dependence R from T allows, when monitoring pressure without a thermometer, to determine the boiling point of water using a similar table:
Second definition of a function.
If each argument value X corresponds to one function value at, then the function is called unambiguous; if two or more, then polysemantic(two-digit, three-digit). If it is not stated that a function is multi-valued, it should be understood that it is single-valued.
For example:
Sum ( S) angles of a polygon are number function (n) sides. Argument n can only take integer values, but not less than 3 . Addiction S from n expressed through the formula:
S = π (n - 2).
Per unit of measurement in in this example taken as radian. Wherein n- This argument function S And functional dependence n from S expressed by the formula:
n = S/ π + 2.
ArgumentS can only take values that are multiples of π , (π , 2 π , 3 π etc.).
Let's explain one more thing example:
Side of a square X is a function of its area S (x = √ S). The argument can take any positive value.
Argument- it's always variable quantity, function, usually, too variable quantity, depending on the argument, but the possibility of its constancy is not excluded.
For example:
The distance of a moving point from a stationary one is a function of the travel time; it usually changes, but when the point moves around a circle, the distance from the center remains constant.
At the same time, the duration of movement in a circle is not function of distance from the center.
So when the function is constant value , then the argument and function cannot be swapped.
1) Function domain and function range.
The domain of a function is the set of all valid real values argument x(variable x), for which the function y = f(x) determined. The range of a function is the set of all real values y, which the function accepts.
IN elementary mathematics functions are studied only on the set of real numbers.
2) Function zeros.
Function zero is the value of the argument at which the value of the function is equal to zero.
3) Intervals of constant sign of a function.
Intervals of constant sign of a function are sets of argument values on which the function values are only positive or only negative.
4) Monotonicity of the function.
An increasing function (in a certain interval) is a function in which a larger value of the argument from this interval corresponds to a larger value of the function.
A decreasing function (in a certain interval) is a function in which a larger value of the argument from this interval corresponds to a smaller value of the function.
5) Even (odd) function.
An even function is a function whose domain of definition is symmetrical with respect to the origin and for any X from the domain of definition the equality f(-x) = f(x). The graph of an even function is symmetrical about the ordinate.
An odd function is a function whose domain of definition is symmetrical with respect to the origin and for any X from the domain of definition the equality is true f(-x) = - f(x). The graph of an odd function is symmetrical about the origin.
6) Limited and unlimited functions.
A function is called bounded if there is such a positive number M such that |f(x)| ≤ M for all values of x. If such a number does not exist, then the function is unlimited.
7) Periodicity of the function.
A function f(x) is periodic if there is a non-zero number T such that for any x from the domain of definition of the function the following holds: f(x+T) = f(x). This smallest number is called the period of the function. All trigonometric functions are periodic. (Trigonometric formulas).
19. Basic elementary functions, their properties and graphs. Application of functions in economics.
Basic elementary functions. Their properties and graphs
1. Linear function.
Linear function is called a function of the form , where x is a variable, a and b are real numbers.
Number A called slope straight, he equal to tangent the angle of inclination of this straight line to the positive direction of the x-axis. The graph of a linear function is a straight line. It is defined by two points.
Properties of a Linear Function
1. Domain of definition - the set of all real numbers: D(y)=R
2. The set of values is the set of all real numbers: E(y)=R
3. The function takes a zero value when or.
4. The function increases (decreases) over the entire domain of definition.
5. A linear function is continuous over the entire domain of definition, differentiable and .
2. Quadratic function.
A function of the form, where x is a variable, coefficients a, b, c are real numbers, is called quadratic