- Answers to exam questions on public health and healthcare.
- 1. Public health and healthcare as a science and area of practical activity. Main goals. Object, subject of study. Methods.
- 2. Healthcare. Definition. History of healthcare development. Modern healthcare systems, their characteristics.
- 3. State policy in the field of protecting public health (Law of the Republic of Belarus “On Health Care”). Organizational principles of the public health care system.
- 4. Insurance and private forms of healthcare.
- 5. Prevention, definition, principles, modern problems. Types, levels, directions of prevention.
- 6. National prevention programs. Their role in improving public health.
- 7. Medical ethics and deontology. Definition of the concept. Modern problems of medical ethics and deontology, characteristics.
- 8. Healthy lifestyle, definition of the concept. Social and medical aspects of a healthy lifestyle (healthy lifestyle).
- 9. Hygienic training and education, definition, basic principles. Methods and means of hygienic training and education. Requirements for the lecture, sanitary bulletin.
- 10. Population health, factors influencing public health. Health formula. Indicators characterizing public health. Analysis scheme.
- 11. Demography as a science, definition, content. The importance of demographic data for health care.
- 12. Population statistics, study methods. Population censuses. Types of age structures of the population.
- 13. Mechanical movement of the population. Characteristics of migration processes, their impact on population health indicators.
- 14. Fertility as a medical and social problem. Methodology for calculating indicators. Fertility levels according to WHO data. Modern tendencies.
- 15. Special fertility indicators (fertility indicators). Population reproduction, types of reproduction. Indicators, calculation methods.
- 16. Mortality as a medical and social problem. Study methodology, indicators. Overall mortality levels according to WHO data. Modern tendencies.
- 17. Infant mortality as a medical and social problem. Factors determining its level.
- 18. Maternal and perinatal mortality, main causes. Indicators, calculation methods.
- 19. Natural movement of the population, factors influencing it. Indicators, calculation methods. Basic patterns of natural movement in Belarus.
- 20. Family planning. Definition. Modern problems. Medical organizations and family planning services in the Republic of Belarus.
- 21. Morbidity as a medical and social problem. Modern trends and features in the Republic of Belarus.
- 22. Medical and social aspects of the neuropsychic health of the population. Organization of psychoneurological care
- 23. Alcoholism and drug addiction as a medical and social problem
- 24. Diseases of the circulatory system as a medical and social problem. Risk factors. Directions of prevention. Organization of cardiac care.
- 25. Malignant neoplasms as a medical and social problem. Main directions of prevention. Organization of oncological care.
- 26. International statistical classification of diseases. Principles of construction, procedure for use. Its significance in the study of morbidity and mortality of the population.
- 27. Methods for studying population morbidity, their comparative characteristics.
- Methodology for studying general and primary morbidity
- Indicators of general and primary morbidity.
- Indicators of infectious morbidity.
- Main indicators characterizing the most important non-epidemic morbidity.
- Main indicators of “hospitalized” morbidity:
- 4) Diseases with temporary disability (question 30)
- Main indicators for the analysis of morbidity with VUT.
- 31. Study of morbidity according to preventive examinations of the population, types of preventive examinations, procedure. Health groups. The concept of “pathological affection”.
- 32. Morbidity according to data on causes of death. Study methodology, indicators. Medical death certificate.
- Main morbidity indicators based on causes of death:
- 33. Disability as a medical and social problem Definition of the concept, indicators. Disability trends in the Republic of Belarus.
- Disability trends in the Republic of Belarus.
- 34. Primary health care (PHC), definition, content, role and place in the health care system for the population. Main functions.
- 35. Basic principles of primary health care. Medical organizations of primary health care.
- 36. Organization of medical care provided to the population on an outpatient basis. Basic principles. Institutions.
- 37. Organization of medical care in a hospital setting. Institutions. Indicators of provision of inpatient care.
- 38. Types of medical care. Organization of specialized medical care for the population. Centers for specialized medical care, their tasks.
- 39. Main directions for improving inpatient and specialized care in the Republic of Belarus.
- 40. Protecting the health of women and children in the Republic of Belarus. Control. Medical organizations.
- 41. Modern problems of women's health. Organization of obstetric and gynecological care in the Republic of Belarus.
- 42. Organization of medical and preventive care for children. Leading problems in children's health.
- 43. Organization of health care for the rural population, basic principles of providing medical care to rural residents. Stages. Organizations.
- Stage II – territorial medical association (TMO).
- Stage III – regional hospital and regional medical institutions.
- 45. Medical and social examination (MSE), definition, content, basic concepts.
- 46. Rehabilitation, definition, types. Law of the Republic of Belarus “On the Prevention of Disability and Rehabilitation of Disabled Persons”.
- 47. Medical rehabilitation: definition of the concept, stages, principles. Medical rehabilitation service in the Republic of Belarus.
- 48. City clinic, structure, tasks, management. Key performance indicators of the clinic.
- Key performance indicators of the clinic.
- 49. The local principle of organizing outpatient care for the population. Types of plots. Territorial therapeutic area. Standards. Contents of the work of a local physician-therapist.
- Organization of the work of a local therapist.
- 50. Office of infectious diseases of the clinic. Sections and methods of work of a doctor in the office of infectious diseases.
- 52. Main indicators characterizing the quality and effectiveness of dispensary observation. Method of their calculation.
- 53. Department of medical rehabilitation (MR) of the clinic. Structure, tasks. The procedure for referring patients to the OMR.
- 54. Children's clinic, structure, tasks, sections of work. Features of providing medical care to children in outpatient settings.
- 55. The main sections of the work of a local pediatrician. Contents of treatment and preventive work. Communication in work with other treatment and preventive institutions. Documentation.
- 56. Contents of preventive work of a local pediatrician. Organization of nursing care for newborns.
- 57. Structure, organization, content of the work of the antenatal clinic. Indicators of work on servicing pregnant women. Documentation.
- 58. Maternity hospital, structure, organization of work, management. Performance indicators of the maternity hospital. Documentation.
- 59. City hospital, its tasks, structure, main performance indicators. Documentation.
- 60. Organization of the work of the hospital reception department. Documentation. Measures to prevent nosocomial infections. Therapeutic and protective regime.
- Section 1. Information about the divisions and installations of the treatment and preventive organization.
- Section 2. Staff of the treatment and prevention organization at the end of the reporting year.
- Section 3. Work of doctors of the clinic (outpatient clinic), dispensary, consultations.
- Section 4. Preventive medical examinations and work of dental (dental) and surgical offices of a medical and preventive organization.
- Section 5. Work of medical and auxiliary departments (offices).
- Section 6. Operation of diagnostic departments.
- 62. Annual report on the activities of the hospital (form 14), procedure for preparation, structure. Key performance indicators of the hospital.
- Section 1. Composition of patients in the hospital and outcomes of their treatment
- Section 2. Composition of sick newborns transferred to other hospitals at the age of 0-6 days and the outcomes of their treatment
- Section 3. Bed capacity and its use
- Section 4. Surgical work of the hospital
- 63. Report on medical care for pregnant women, women in labor and postpartum women (f. 32), structure. Basic indicators.
- Section I. Activities of the antenatal clinic.
- Section II. Obstetrics in a hospital
- Section III. Maternal mortality
- Section IV. Information about births
- 64. Medical genetic counseling, main institutions. Its role in the prevention of perinatal and infant mortality.
- 65. Medical statistics, its sections, tasks. The role of the statistical method in the study of population health and the performance of the health care system.
- 66. Statistical population. Definition, types, properties. Features of conducting statistical research on a sample population.
- 67. Sample population, requirements for it. The principle and methods of forming a sample population.
- 68. Unit of observation. Definition, characteristics of accounting characteristics.
- 69. Organization of statistical research. Characteristics of the stages.
- 70. Contents of the plan and program of statistical research. Types of statistical research plans. Observation program.
- 71. Statistical observation. Continuous and non-continuous statistical research. Types of incomplete statistical research.
- 72. Statistical observation (collection of materials). Errors in statistical observation.
- 73. Statistical grouping and summary. Typological and variational grouping.
- 74. Statistical tables, types, construction requirements.
81. Standard deviation, calculation method, application.
An approximate method for assessing the variability of a variation series is to determine the limit and amplitude, but the values of the variant within the series are not taken into account. The main generally accepted measure of the variability of a quantitative characteristic within a variation series is standard deviation (σ - sigma). The larger the standard deviation, the higher the degree of fluctuation of this series.
The method for calculating the standard deviation includes the following steps:
1. Find the arithmetic mean (M).
2. Determine the deviations of individual options from the arithmetic mean (d=V-M). In medical statistics, deviations from the average are designated as d (deviate). The sum of all deviations is zero.
3. Square each deviation d 2.
4. Multiply the squares of the deviations by the corresponding frequencies d 2 *p.
5. Find the sum of the products (d 2 *p)
6. Calculate the standard deviation using the formula:
when n is greater than 30,
or  when n is less than or equal to 30, where n is the number of all options.
Standard deviation value:
1. The standard deviation characterizes the spread of the variant relative to the average value (i.e., the variability of the variation series). The larger the sigma, the higher the degree of diversity of this series.
2. The standard deviation is used for a comparative assessment of the degree of correspondence of the arithmetic mean to the variation series for which it was calculated.
Variations of mass phenomena obey the law of normal distribution. The curve representing this distribution looks like a smooth bell-shaped symmetrical curve (Gaussian curve). According to the theory of probability, in phenomena that obey the law of normal distribution, there is a strict mathematical relationship between the values of the arithmetic mean and the standard deviation. The theoretical distribution of a variant in a homogeneous variation series obeys the three-sigma rule.
If in a system of rectangular coordinates the values of a quantitative characteristic (variants) are plotted on the abscissa axis, and the frequency of occurrence of a variant in a variation series is plotted on the ordinate axis, then variants with larger and smaller values are evenly located on the sides of the arithmetic mean.
It has been established that with a normal distribution of the trait:
68.3% of the values of the option are within M1
95.5% of the values of the option are within M2
99.7% of the values of the option are within M3
3. The standard deviation allows you to establish normal values for clinical and biological parameters. In medicine, the interval M1 is usually taken as the normal range for the phenomenon being studied. The deviation of the estimated value from the arithmetic mean by more than 1 indicates a deviation of the studied parameter from the norm.
4. In medicine, the three-sigma rule is used in pediatrics for individual assessment of the level of physical development of children (sigma deviation method), for the development of standards for children's clothing
5. The standard deviation is necessary to characterize the degree of diversity of the characteristic being studied and to calculate the error of the arithmetic mean.
The value of the standard deviation is usually used to compare the variability of series of the same type. If two series with different characteristics are compared (height and weight, average duration of hospital treatment and hospital mortality, etc.), then a direct comparison of sigma sizes is impossible , because standard deviation is a named value expressed in absolute numbers. In these cases, use the coefficient of variation (Cv) , which is a relative value: the percentage ratio of the standard deviation to the arithmetic mean.
The coefficient of variation is calculated using the formula:

The higher the coefficient of variation , the greater the variability of this series. It is believed that a coefficient of variation of more than 30% indicates the qualitative heterogeneity of the population.
Instructions
Let there be several numbers characterizing homogeneous quantities. For example, the results of measurements, weighings, statistical observations, etc. All quantities presented must be measured using the same measurement. To find the standard deviation, do the following:
Determine the arithmetic mean of all numbers: add all the numbers and divide the sum by the total number of numbers.
Determine the dispersion (scatter) of numbers: add the squares of the previously found deviations and divide the resulting sum by the number of numbers.
There are seven patients in the ward with temperatures of 34, 35, 36, 37, 38, 39 and 40 degrees Celsius.
It is required to determine the average deviation from the mean.
Solution:
“in the ward”: (34+35+36+37+38+39+40)/7=37 ºС;
Temperature deviations from the average (in this case, the normal value): 34-37, 35-37, 36-37, 37-37, 38-37, 39-37, 40-37, resulting in: -3, -2, -1 , 0, 1, 2, 3 (ºС);
Divide the sum of numbers obtained earlier by their number. For accurate calculations, it is better to use a calculator. The result of division is the arithmetic mean of the numbers added.
Pay attention to all stages of the calculation, since an error in even one of the calculations will lead to an incorrect final indicator. Check your calculations at every stage. The arithmetic average has the same meter as the summed numbers, that is, if you determine the average attendance, then all your indicators will be “person”.
This calculation method is used only in mathematical and statistical calculations. For example, the arithmetic mean in computer science has a different calculation algorithm. The arithmetic mean is a very relative indicator. It shows the probability of an event, provided that it has only one factor or indicator. For the most in-depth analysis, many factors must be taken into account. For this purpose, the calculation of more general quantities is used.
The arithmetic mean is one of the measures of central tendency, widely used in mathematics and statistical calculations. Finding the arithmetic average for several values is very simple, but each task has its own nuances, which are simply necessary to know in order to perform correct calculations.
Quantitative results of similar experiments.
How to find the arithmetic mean
Finding the arithmetic mean for an array of numbers should begin by determining the algebraic sum of these values. For example, if the array contains the numbers 23, 43, 10, 74 and 34, then their algebraic sum will be equal to 184. When writing, the arithmetic mean is denoted by the letter μ (mu) or x (x with a bar). Next, the algebraic sum should be divided by the number of numbers in the array. In the example under consideration there were five numbers, so the arithmetic mean will be equal to 184/5 and will be 36.8.Features of working with negative numbers
If the array contains negative numbers, then the arithmetic mean is found using a similar algorithm. The difference only exists when calculating in the programming environment, or if the problem has additional conditions. In these cases, finding the arithmetic mean of numbers with different signs comes down to three steps:1. Finding the general arithmetic average using the standard method;
2. Finding the arithmetic mean of negative numbers.
3. Calculation of the arithmetic mean of positive numbers.
The responses for each action are written separated by commas.
Natural and decimal fractions
If an array of numbers is represented by decimal fractions, the solution is carried out using the method of calculating the arithmetic mean of integers, but the result is reduced according to the task’s requirements for the accuracy of the answer.When working with natural fractions, they should be reduced to a common denominator, which is multiplied by the number of numbers in the array. The numerator of the answer will be the sum of the given numerators of the original fractional elements.
Defined as a generalizing characteristic of the size of variation of a trait in the aggregate. It is equal to the square root of the average square deviation of individual values of the attribute from the arithmetic mean, i.e. The root of and can be found like this:
1. For the primary row:
2. For the variation series:

Transformation of the standard deviation formula brings it to a form more convenient for practical calculations:
Standard deviation determines how much on average specific options deviate from their average value, and is also an absolute measure of the variability of a characteristic and is expressed in the same units as the options, and is therefore well interpreted.
Examples of finding the standard deviation: ,
For alternative characteristics, the standard deviation formula looks like this:
![]()
where p is the proportion of units in the population that have a certain characteristic;
q is the proportion of units that do not have this characteristic.
The concept of average linear deviation
Average linear deviation is defined as the arithmetic mean of the absolute values of the deviations of individual options from .
1. For the primary row:

2. For the variation series:
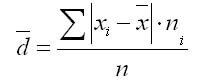
where the sum n is sum of frequencies of variation series.
An example of finding the average linear deviation:
The advantage of the mean absolute deviation as a measure of dispersion over the range of variation is obvious, since this measure is based on taking into account all possible deviations. But this indicator has significant drawbacks. Arbitrary rejection of algebraic signs of deviations can lead to the fact that the mathematical properties of this indicator are far from elementary. This makes it very difficult to use the mean absolute deviation when solving problems involving probabilistic calculations.
Therefore, the average linear deviation as a measure of variation of a characteristic is rarely used in statistical practice, namely when summing up indicators without taking into account signs makes economic sense. With its help, for example, the turnover of foreign trade, the composition of workers, the rhythm of production, etc. are analyzed.
Mean square
Mean square applied, for example, to calculate the average size of the sides of n square sections, the average diameters of trunks, pipes, etc. It is divided into two types.
Simple mean square. If, when replacing individual values of a characteristic with an average value, it is necessary to keep the sum of the squares of the original values unchanged, then the average will be a quadratic average value.
It is the square root of the quotient of dividing the sum of squares of the individual attribute values by their number:
The weighted mean square is calculated using the formula:

where f is the weight sign.
Average cubic
Average cubic applies, for example, when determining the average length of a side and cubes. It is divided into two types.
Average cubic simple:


When calculating average values and dispersion in interval distribution series, the true values of the attribute are replaced by the central values of the intervals, which differ from the arithmetic mean of the values included in the interval. This leads to a systematic error when calculating the variance. V.F. Sheppard determined that error in variance calculation, caused by the use of grouped data, is 1/12 of the square of the interval in both the upward and downward direction of the variance.
Sheppard Amendment should be used if the distribution is close to normal, relates to a characteristic with a continuous nature of variation, and is based on a significant amount of initial data (n > 500). However, based on the fact that in some cases both errors, acting in different directions, compensate each other, it is sometimes possible to refuse to introduce corrections.
The smaller the variance and standard deviation, the more homogeneous the population and the more typical the average will be.
In the practice of statistics, there is often a need to compare variations of various characteristics. For example, it is of great interest to compare variations in the age of workers and their qualifications, length of service and wages, costs and profits, length of service and labor productivity, etc. For such comparisons, indicators of absolute variability of characteristics are unsuitable: it is impossible to compare the variability of work experience, expressed in years, with the variation of wages, expressed in rubles.
To carry out such comparisons, as well as comparisons of the variability of the same characteristic in several populations with different arithmetic averages, a relative indicator of variation is used - the coefficient of variation.
Structural averages
To characterize the central tendency in statistical distributions, it is often rational to use, together with the arithmetic mean, a certain value of the characteristic X, which, due to certain features of its location in the distribution series, can characterize its level.
This is especially important when in a distribution series the extreme values of a characteristic have unclear boundaries. In this regard, an accurate determination of the arithmetic mean is usually impossible or very difficult. In such cases, the average level can be determined by taking, for example, the value of the feature that is located in the middle of the frequency series or that occurs most often in the current series.
Such values depend only on the nature of the frequencies, i.e., on the structure of the distribution. They are typical in location in a series of frequencies, therefore such values are considered as characteristics of the center of the distribution and therefore received the definition of structural averages. They are used to study the internal structure and structure of the distribution series of attribute values. Such indicators include:
To calculate the simple geometric mean, the formula is used:
Geometric weighted
To determine the weighted geometric mean, the formula is used:
The average diameters of wheels, pipes, and the average sides of squares are determined using the mean square.
Root-mean-square values are used to calculate some indicators, for example, the coefficient of variation, which characterizes the rhythm of production. Here the standard deviation from the planned production output for a certain period is determined using the following formula:
These values accurately characterize the change in economic indicators compared to their base value, taken in its average value.
Quadratic simple
The root mean square is calculated using the formula:

Quadratic weighted
The weighted mean square is equal to:

22. Absolute indicators of variation include:
range of variation
average linear deviation
dispersion
standard deviation
Range of variation (r)
Range of variation- is the difference between the maximum and minimum values of the attribute
It shows the limits within which the value of a characteristic changes in the population being studied.
The work experience of the five applicants in previous work is: 2,3,4,7 and 9 years. Solution: range of variation = 9 - 2 = 7 years.
For a generalized description of differences in attribute values, average variation indicators are calculated based on taking into account deviations from the arithmetic mean. The difference is taken as a deviation from the average.
In this case, in order to avoid the sum of deviations of variants of a characteristic from the average turning to zero (zero property of the average), one must either ignore the signs of the deviation, that is, take this sum modulo , or square the deviation values
Average linear and square deviation
Average linear deviation is the arithmetic average of the absolute deviations of individual values of a characteristic from the average.
The average linear deviation is simple:
The work experience of the five applicants in previous work is: 2,3,4,7 and 9 years.
In our example: years;
Answer: 2.4 years.
Average linear deviation weighted applies to grouped data:
Due to its convention, the average linear deviation is used in practice relatively rarely (in particular, to characterize the fulfillment of contractual obligations regarding uniformity of delivery; in the analysis of product quality, taking into account the technological features of production).
Standard deviation
The most perfect characteristic of variation is the mean square deviation, which is called the standard (or standard deviation). Standard deviation() is equal to the square root of the average square deviation of the individual values of the arithmetic average attribute:
The standard deviation is simple:


Weighted standard deviation is applied to grouped data:

Between the root mean square and mean linear deviations under normal distribution conditions the following ratio takes place: ~ 1.25.
The standard deviation, being the main absolute measure of variation, is used in determining the ordinate values of a normal distribution curve, in calculations related to the organization of sample observation and establishing the accuracy of sample characteristics, as well as in assessing the limits of variation of a characteristic in a homogeneous population.
Standard deviation is a classic indicator of variability from descriptive statistics.
Standard deviation, standard deviation, standard deviation, sample standard deviation (eng. standard deviation, STD, STDev) - a very common indicator of dispersion in descriptive statistics. But, because technical analysis is akin to statistics; this indicator can (and should) be used in technical analysis to detect the degree of dispersion of the price of the analyzed instrument over time. Denoted by the Greek symbol Sigma "σ".
Thanks to Carl Gauss and Pearson for allowing us to use standard deviation.
Using standard deviation in technical analysis, we turn this "dispersion index"" V "volatility indicator“, maintaining the meaning, but changing the terms.
What is standard deviation
But besides the intermediate auxiliary calculations, standard deviation is quite acceptable for independent calculation and applications in technical analysis. As an active reader of our magazine burdock noted, “ I still don’t understand why the standard deviation is not included in the set of standard indicators of domestic dealing centers«.
Really, standard deviation can measure the variability of an instrument in a classic and “pure” way. But unfortunately, this indicator is not so common in securities analysis.
Applying standard deviation
Manually calculating the standard deviation is not very interesting, but useful for experience. Standard deviation can be expressed formula STD=√[(∑(x-x ) 2)/n] , which sounds like the root of the sum of squared differences between the elements of the sample and the mean, divided by the number of elements in the sample.
If the number of elements in the sample exceeds 30, then the denominator of the fraction under the root takes the value n-1. Otherwise n is used.
Step by step standard deviation calculation:
- calculate the arithmetic mean of the data sample
- subtract this average from each sample element
- we square all the resulting differences
- sum up all the resulting squares
- divide the resulting amount by the number of elements in the sample (or by n-1, if n>30)
- calculate the square root of the resulting quotient (called dispersion)